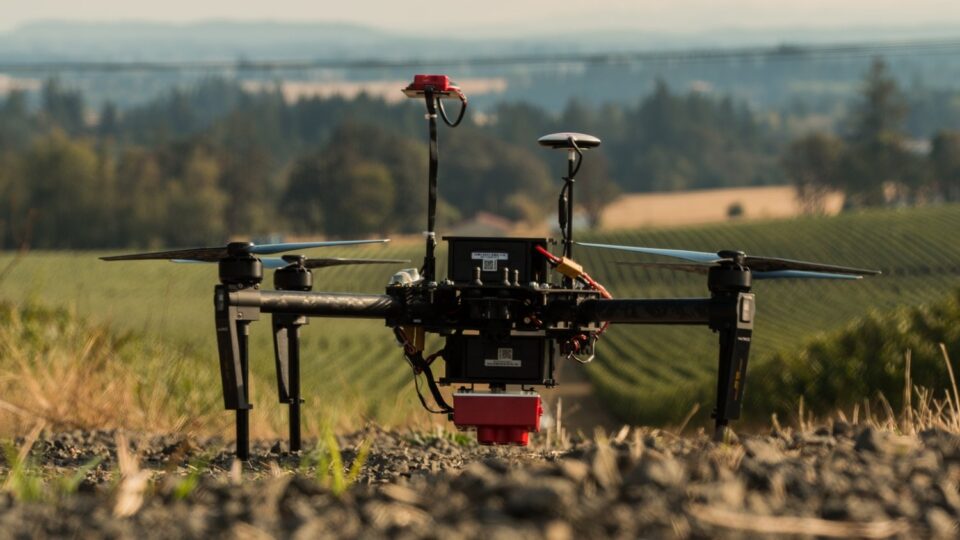
Multispectral Drone T3-MS
Crop Monitoring Sensor Drones In India
Early detection of crop health, much before visible to naked eye.
Scientifically Accepted - Industry Admired & Farming Game Changer
TRITHI Robotics provides finest & industry best crop data analysis sensors in India.
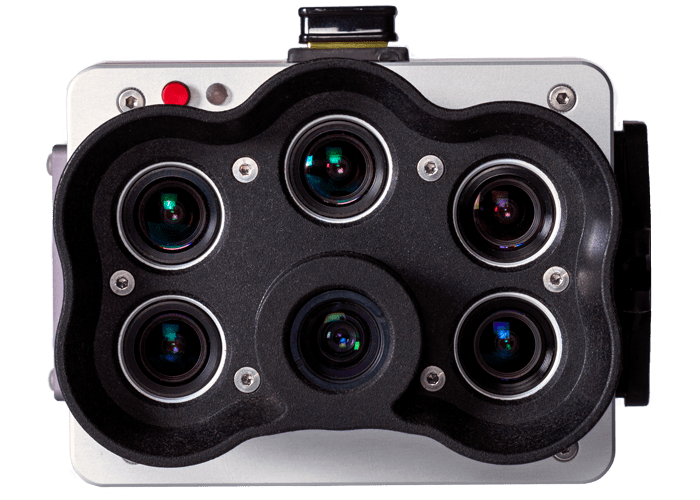
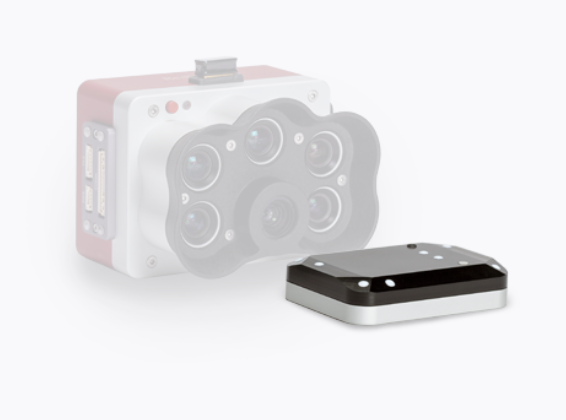
TRITHI is certified partner of Micasense (an AGEagle Company USA) for India, with Its Rededge M, Rededge MX and Rededge P are some of world’s best sensors available to use on any of the flying platform to capture the farm images.
Post capture, one can transfer images to computer for image processing and generate 30 types of indices for analysis & prescriptions.
In a Nutshell
Farmland Acreage
100 acres in 20 Mins Fly
Data Capture
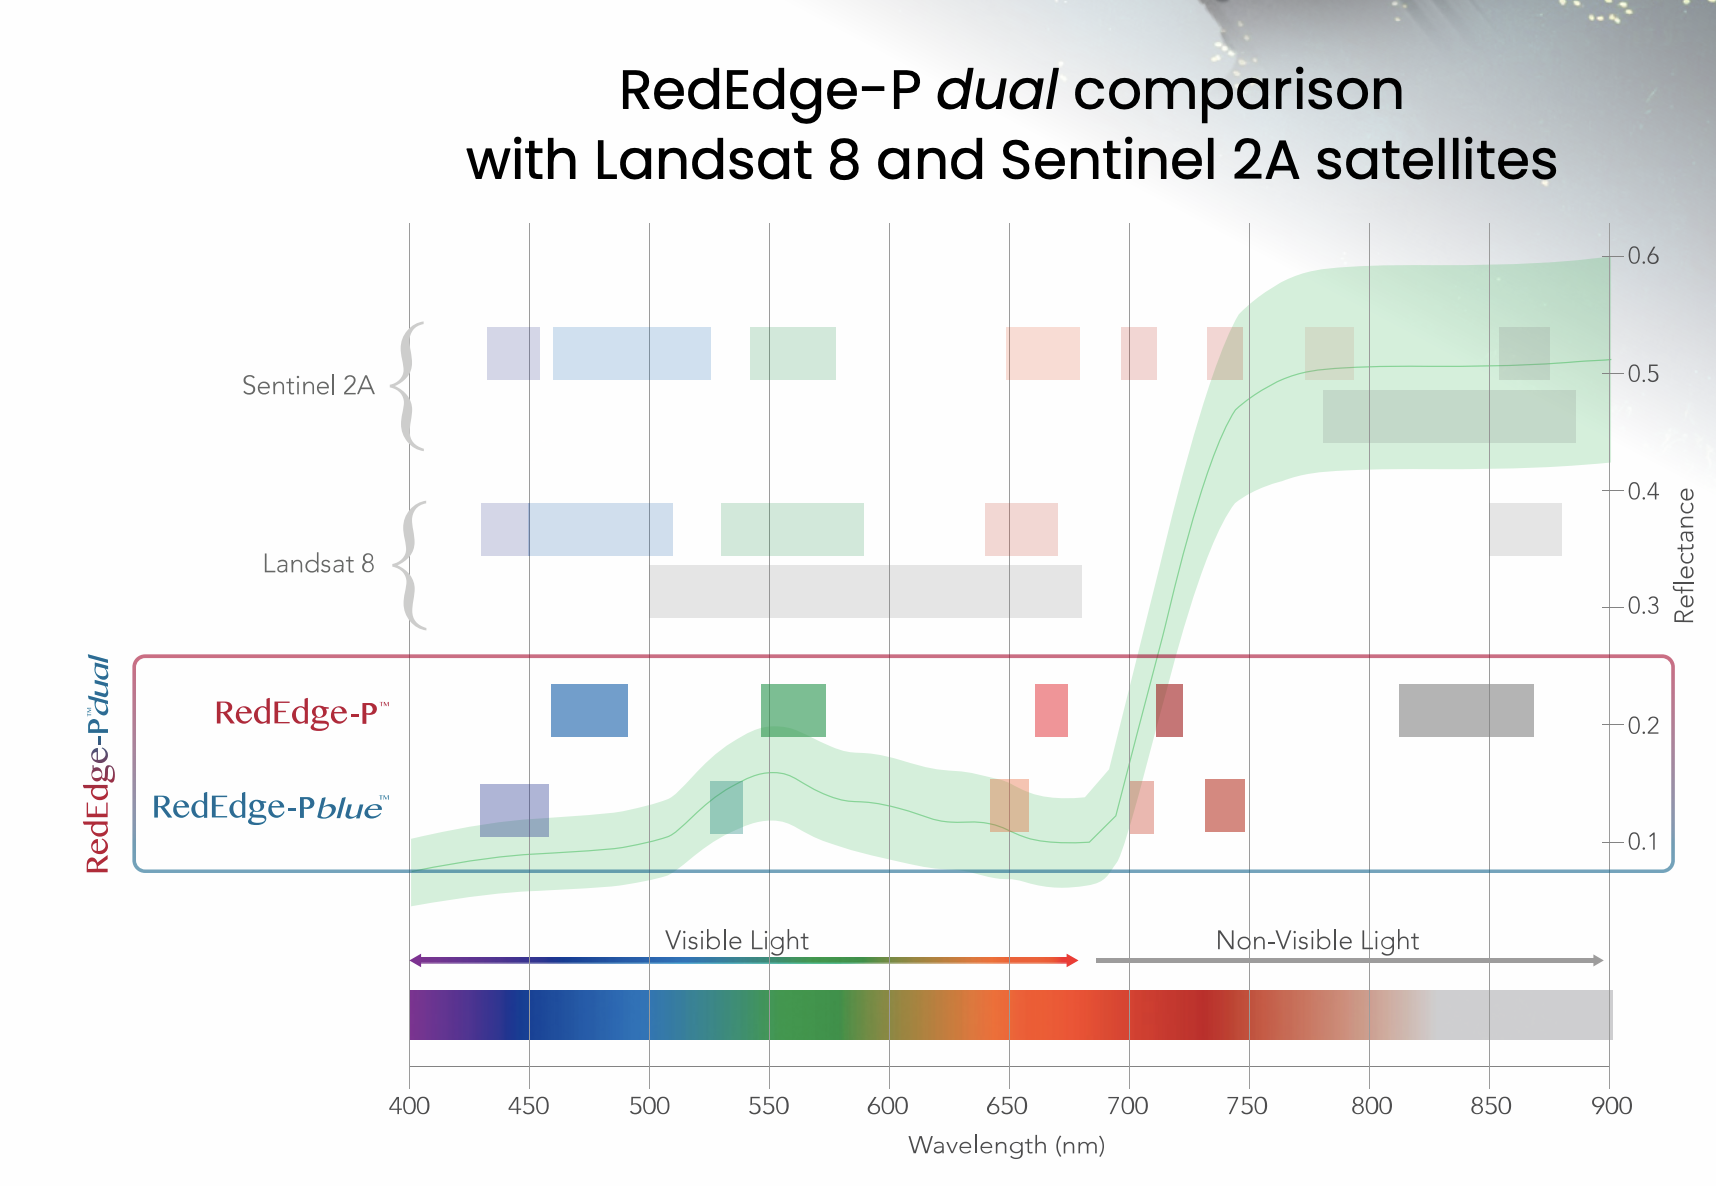
Red, Green, Blue, Rededge & Near-Infrared (Panchromatic in P)
Integration Location
BLR – KA – India
Turn Around
30 mins to 4 hours

Core Capabilities
Work type
Crop Health Monitoring & Data Process & Analysis
Major Outputs
NDRE, RGB, CIR, NDVI, DSM, Chlorophyll Map Etc.
Data Use Cases
30 Type of Indices
Equipment Setup
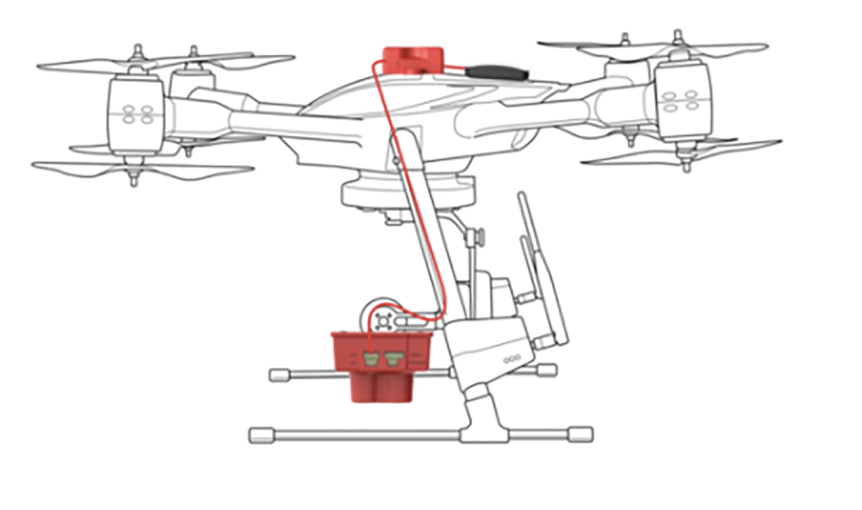
UAV integrated with Multispectral Camera.
Find Early – Act Now – Save Crop
CALIBRATED NARROW BANDS
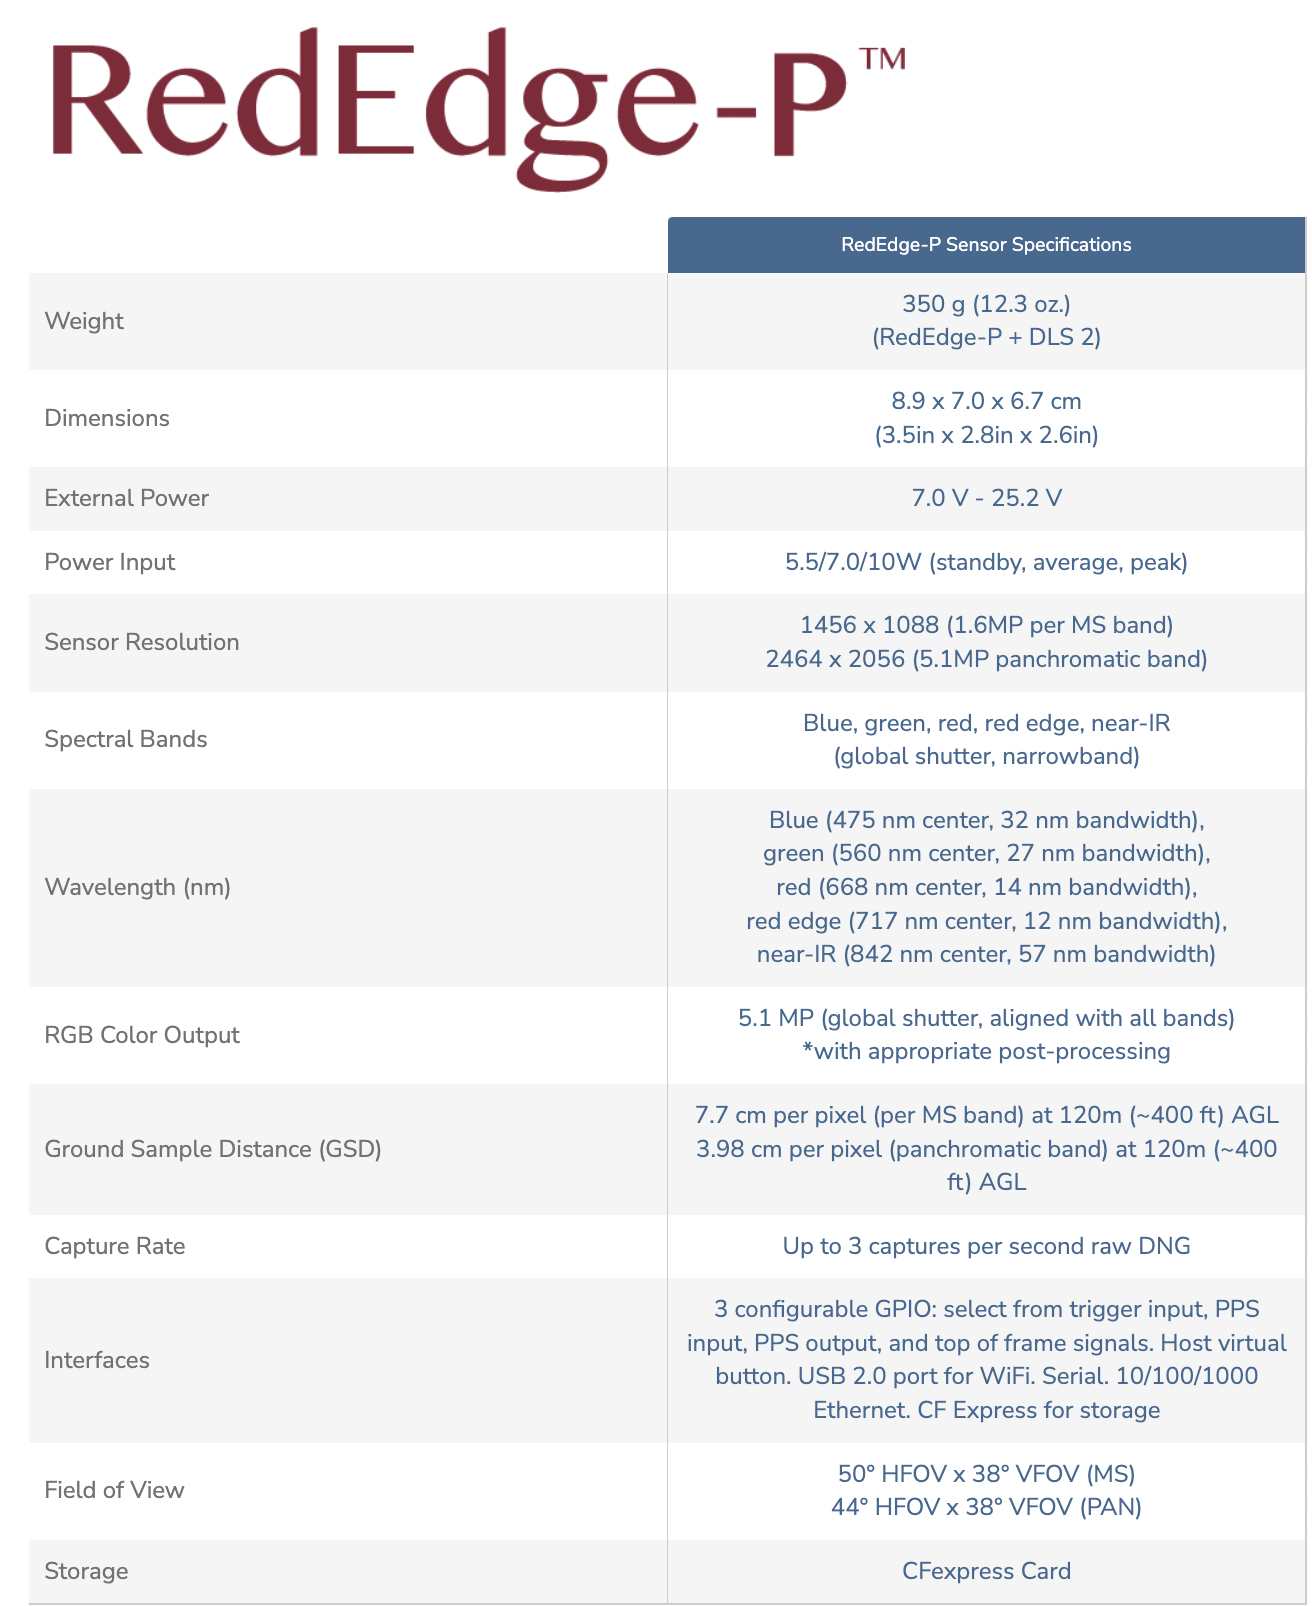
Five narrow high resolution (8 cm/pixel at 400 ft) spectral bands captured during one flight. Calibrated for precise, repeatable measurements.
RUGGED AND DURABLE
New aluminum body for better durability and performance in higher temperatures. Global shutter imagers – no gimbal required and no moving parts.
FULL FLEXIBILITY
Compact size allows for integration with a wide variety of drones. Full access to raw data; outputs can be generated using a wide variety of processing and analysis platforms.
MICASENSE INCREASES DATA ACCURACY
AND REPEATABILITY
Examples
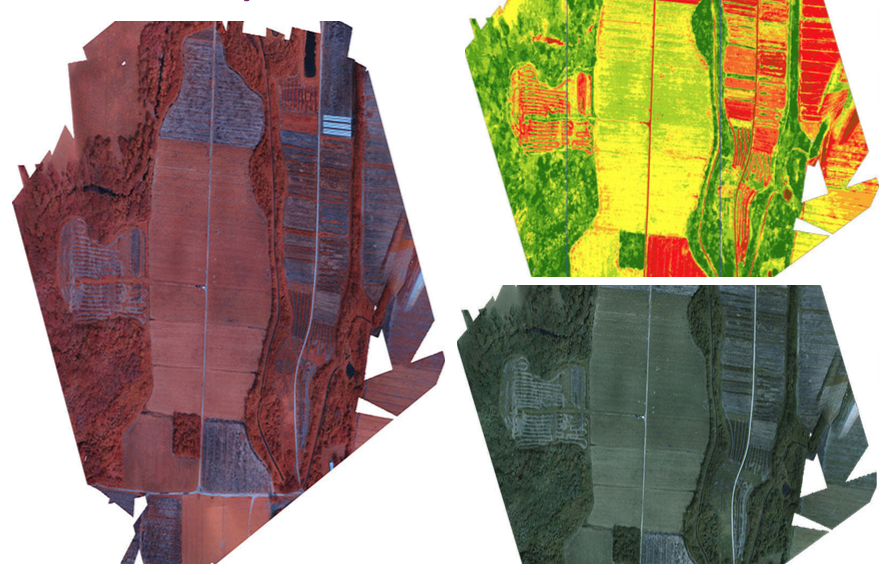
CAPTURE – PROCESS – ANALYSE
| PLANT COUNTING | Plant counting algorithms require high-resolution imagery. RedEdge-P combines a Panchromatic lens with 5-high-res multispectral lenses enabling high-res RGB and multispectral outputs, allowing plant count even at early growth stages. |
| PHENOTYPING | Manually measuring plant characteristics is time-consuming. RedEdge-P band combination enables high-resolution multispectral outputs, allowing the detection of variability at the leaf level. |
| PLANT HEALTH MAPPING | RedEdge-P’s high-resolution multispectral outputs allow the generation of indices and composites to see individual chlorophyll levels in the plants and compare over time. |
| FERTILIZER MANAGEMENT | RedEdge-P’s high-res and accurate outputs allow easy identification of areas low in nutrients and help monitor the effects of fertilizer applications throughout the season and determine if, when, and where a new application is needed. |
| DISEASE IDENTIFICATION | RedEdge–P captures a critical part of the light spectrum for studying plants (712–722 nm), called the red edge band. It is in this section of the spectrum that the first signs of stress start to show. Using analytics generated with the red edge band, it is possible to identify disease sooner and act faster to stop the spread. |
| SPECIES DIFFERENTIATION | Some differences among species may not be visible to the naked eye. High-res multispectral data allows for species differentiation, weeds included, by highlighting characteristics such as chlorophyll content, vigor, and leaf size. |
| ADVANCED CROP SCOUTING | High-res multispectral and RGB imagery provides advanced field scouting capabilities. In one flight, it is possible to collect accurate and geotagged information of a problem, making it easy to assess the situation and determine the appropriate intervention. |
| HIGH-RES 3D Point Clouds | RedEdge-P’s 5.1-Megapixel panchromatic band provides over twice the ground resolution of the industry-standard RedEdge-MX, resulting in 3D point clouds with up to 4 times the point density. |

Need to Buy?Reach Us
